


In today’s digital world, where 63.1% of the global population has access to the internet, businesses can’t afford to not have a website.
From helping you convey your story to giving your audience the ability to purchase your products or learn more about your services, your website acts as a virtual front desk for your business.
But, even after investing time and money in website design, development, and maintenance, many businesses face a hard time generating leads and converting them into paying customers.
Maybe you’re struggling to attract traffic to your website. Or maybe you’re attracting a good amount of website visitors, but you’re struggling to convert them into paying customers.
Getting your website up and running is just the first step. Post-launch, you need to consistently monitor and keep an eye on the right metrics to understand what’s working and what’s not. That’s the key to building a website that converts.
5 Website Metrics Businesses Should Track
Not sure if your website is working for you? We’ve got you covered. Let’s dive into the five most important website metrics businesses should track.
1 – Website Traffic
The first (and one of the most important) metrics that you should track is website traffic. And—spoiler alert—web traffic is more than the number of people who visit your website.
To better understand how well your website is performing, you should have a solid understanding of:
- Number of unique users
- Sessions by country
- New users vs. returning users
- Bounce rate (the number of website visitors that only visit one page on your site)
- Traffic sources (where your website visitors come from)
- User demographics (who is visiting your website)
- Lifetime value (the total worth of a customer to a business)
Tracking these metrics will help you determine whether your marketing and advertising campaigns are delivering results or not.
If you spend $1,000 every month on Google Ads but have a high bounce rate, maybe those ads aren’t as effective as you may have thought.
If your target audience is based in the U.S. but the majority of your visitors are from Asia, it’s time to revamp your strategy.
Numbers don’t lie. You’ll only know whether your campaigns are working if you keep a pulse on your traffic data.
2 – Page Load Speed
Your priority should be to deliver a great overall user experience—and your website can contribute to (or take away from) those efforts. The modern consumer craves convenience, and nothing is more convenient than speed.
Websites that take less than two seconds to load have an average bounce rate of 9%. Whereas, sites that take around five seconds to load have a bounce rate of 38%.
A website that takes forever to load will result in more and more visitors bouncing off. And that’s not what you want.
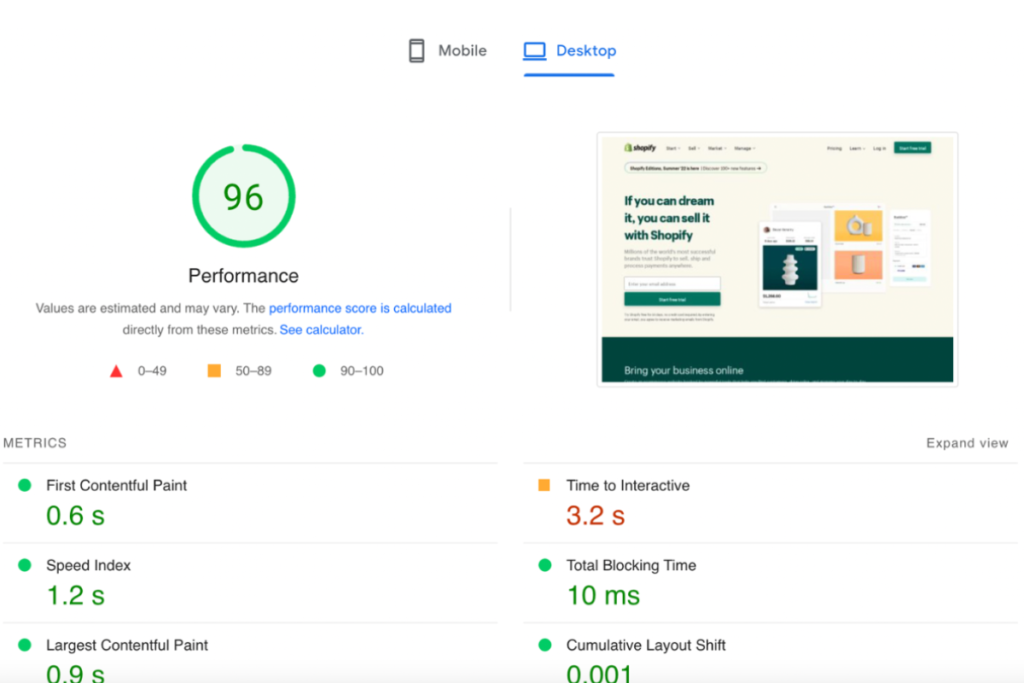
To track your website speed, head over to Google Page Speed Insights, type in your website URL, and hit “Analyze.”
If your PageSpeed Insights score falls under 49, it’s time to optimize your website. A score between 90 and 100 is fantastic. It’s also important to note that you should pay attention to both your mobile and desktop scores, as people will probably find you from a variety of devices.
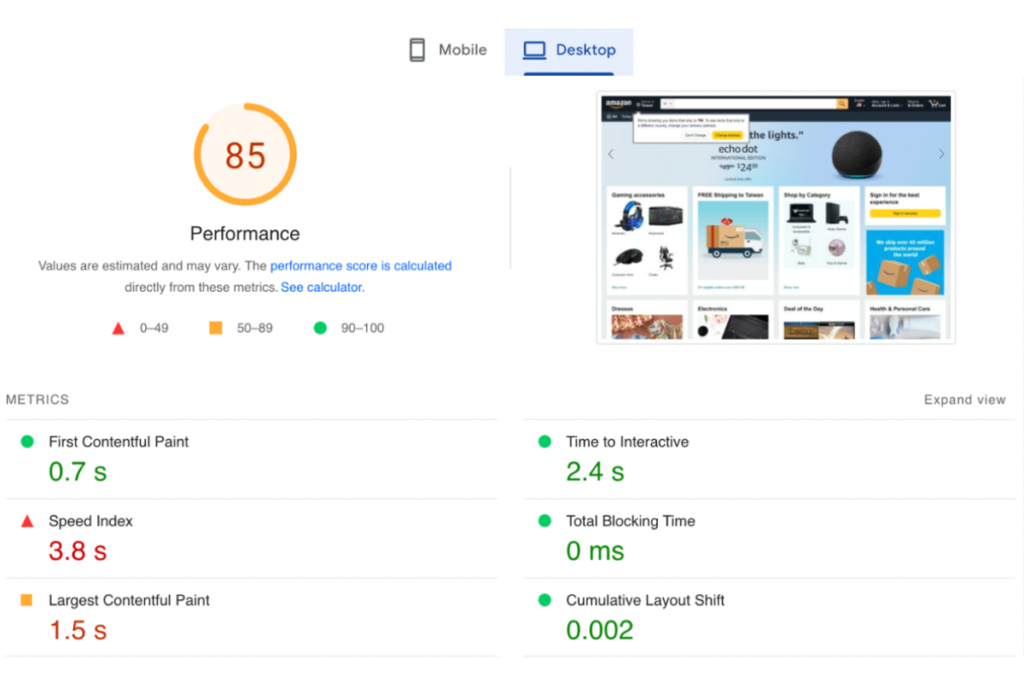
For fun, let’s take a look at the page loading speed for a couple of well-known websites.
Shopify:
Amazon:
3 – Top Viewed Pages
What if you attract more than 1,000 to your website every day, but you only see two or three goal completions on a weekly basis?
Disheartening, isn’t it?
Maybe, the majority of traffic you’re attracting to your website is top of the funnel and they aren’t ready to make a purchase…Or maybe you’re attracting the wrong people to your website.
A good way to dig into this issue is to get a better understanding of which pages on your website see the most traffic.
While you can use different SEO tools like Ahrefs or SEMRush to do this, we’d highly recommend using Google Analytics for an accurate report. To track which pages get the most traffic:
- Head over to Google Analytics.
- In the left-hand navigation bar, click on “Behavior.”
- Click on “Site Content.”
- Select “All Pages.”
- From here, you can set the duration for which you want to track page views, unique page views, average time on page, bounce rate, and more.
Alongside this, you can use Google Search Console for additional information like clicks and impressions on different pages. To do this:
- Head over to Google Search Console.
- In the left-hand navigation bar, click on “Performance.”
- Select “Pages.”
- Here, you can see clicks and impressions for different pages.
4 – Goal Completions/Conversion Rate
You’re probably clear on the specific actions you want your website visitors to take (like filling out a contact form or making a purchase). But are you tracking to see whether or not they actually take that action?
Tracking your conversion rate is crucial to understanding how well your website is performing.
If your conversion rate is low, you need to figure out why. If the conversion rate is high, you can further optimize your campaigns and take your business to the next level.
To increase your conversion rate, you can:
- Increase your website speed
- Improve your website user experience
- Use social proof
- Add a pop-up (but make sure it doesn’t tamper with the user experience)
- Strategically implement Call-to-Action buttons
5 – Average Time on Page
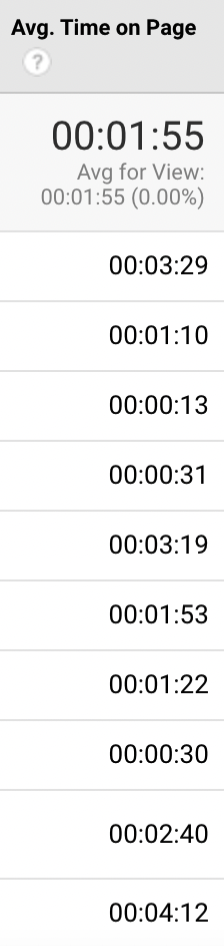
There’s no point in attracting people to your website if they’re bouncing off within two-three seconds. According to Klipfolio Metric HQ, a good benchmark for Average Time on Page across multiple industries stands at 52 seconds.
A good Average Time on Page is an indication that:
- You’re attracting the right people to your website.
- Your website is engaging.
- Your website content is useful to your target audience.
You can track the Average Time on Page for all your web pages by following these steps:
- Go to Google Analytics.
- In the left-hand navigation bar, select “Behavior.”
- Select “Site Content.”
- Click on “All Pages.”
- Here, you can look at the Average Time on Page for every single web page.
If you see certain pages underperforming, figure out what might be causing it, and make any necessary adjustments.
Tap into the Power of Data-Driven Marketing
You may have a visually appealing website, but there’s no point in having it if it’s not delivering results. By getting clear on your website data and what those numbers mean, you can improve the customer experience, increase the number of conversions you see from your website, and grow your business.